Health insurance premiums 1996–2027
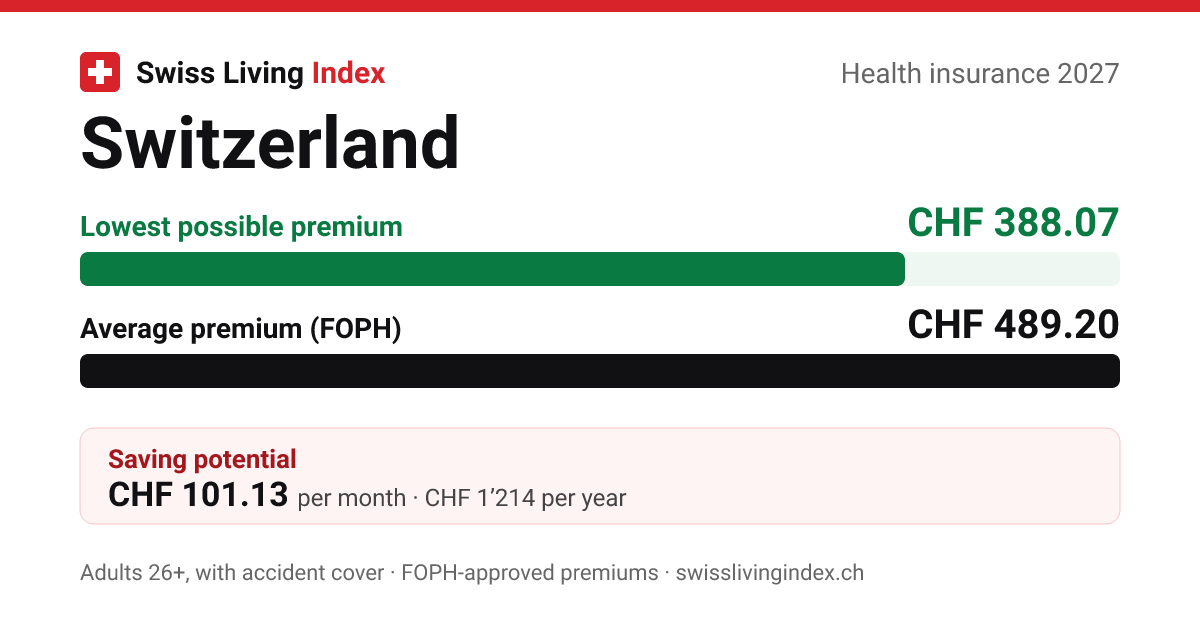
The average adult premium in Switzerland rose from CHF 373.36 (2019) to CHF 489.20 (2027), +31.0%. Since 2019, premiums rose most in Ticino (+47.4%), Nidwalden (+35.8%), Appenzell Outer Rhodes (+35.6%). Before 2019 the FOPH calculated the average differently, so 2010–2018 is shown separately.
Tap a canton.
Red line: selection · grey line: Switzerland
Change of method in 2019: until 2018 the FOPH estimated the average premium only from tariffs with the ordinary deductible and accident cover (standard insurance). From 2019 it is based on premium volume per insured person, i.e. on all models and deductibles people actually chose, so it is lower. In addition, premiums for young adults fell by law from 2019. Changes are only computed within one period.
Mean premium per insured person since 1996
Since 1996 the mean premium per insured person (all ages, all models) has risen from CHF 128.24 to CHF 376.23 a month (2025), +193.4%; for 2027 the FOPH estimates CHF 412.06. This series uses the same method for every year (premium income per insured person).
Red line: selection · grey line: Switzerland
Increase 1996–2025
| Canton | 1996 | 2010 | 2025 | 1996–2025 |
|---|---|---|---|---|
| Switzerland | 128.24 | 236.21 | 376.23 | +193.4% |
| Appenzell Outer Rhodes | 90.69 | 182.48 | 324.78 | +258.1% |
| Grisons | 95.25 | 210.73 | 329.93 | +246.4% |
| Thurgau | 96.62 | 207.61 | 333.63 | +245.3% |
| Aargau | 102.53 | 219.06 | 352.22 | +243.5% |
| Glarus | 99.86 | 202.93 | 338.60 | +239.1% |
| St. Gallen | 99.03 | 199.08 | 328.43 | +231.6% |
| Basel-Landschaft | 131.36 | 251.07 | 425.23 | +223.7% |
| Schaffhausen | 114.79 | 225.43 | 362.28 | +215.6% |
| Solothurn | 119.34 | 223.29 | 376.55 | +215.5% |
| Neuchâtel | 137.20 | 247.88 | 428.57 | +212.4% |
| Lucerne | 105.40 | 200.16 | 325.04 | +208.4% |
| Bern | 124.72 | 255.58 | 383.78 | +207.7% |
| Nidwalden | 101.24 | 170.74 | 310.97 | +207.2% |
| Schwyz | 106.18 | 198.11 | 323.20 | +204.4% |
| Zug | 104.46 | 194.00 | 309.10 | +195.9% |
| Jura | 141.10 | 236.83 | 414.01 | +193.4% |
| Ticino | 160.02 | 271.53 | 467.47 | +192.1% |
| Obwalden | 103.60 | 183.25 | 302.09 | +191.6% |
| Appenzell Inner Rhodes | 88.66 | 163.28 | 256.05 | +188.8% |
| Zurich | 126.06 | 231.36 | 363.19 | +188.1% |
| Valais | 126.92 | 214.03 | 351.45 | +176.9% |
| Uri | 106.98 | 184.86 | 289.37 | +170.5% |
| Fribourg | 133.24 | 216.79 | 355.86 | +167.1% |
| Geneva | 185.05 | 301.83 | 474.31 | +156.3% |
| Basel-Stadt * | 179.87 | 330.29 | 456.33 | +153.7% |
| Vaud | 176.98 | 261.75 | 419.74 | +137.2% |
* Basel-Stadt 1996–2012: including the contributions the canton paid directly to one insurer (FOPH). Source: FOPH, Statistics of compulsory health insurance, T 3.01 and T 8.09.
Premium increase 2019–2027 (adults)
- Ticino: +47.4% (CHF 409.64 → 603.66)
- Nidwalden: +35.8% (CHF 292.57 → 397.20)
- Appenzell Outer Rhodes: +35.6% (CHF 311.32 → 422.30)
- Aargau: +35.4% (CHF 343.24 → 464.70)
- Thurgau: +35.2% (CHF 320.47 → 433.20)
- Jura: +34.8% (CHF 408.67 → 551.00)
- Neuchâtel: +34.6% (CHF 415.20 → 558.80)
- Solothurn: +33.6% (CHF 369.29 → 493.50)
- Fribourg: +32.5% (CHF 351.40 → 465.48)
- Zurich: +31.4% (CHF 363.00 → 477.08)
- Basel-Landschaft: +31.2% (CHF 415.10 → 544.66)
- Uri: +31.1% (CHF 288.07 → 377.70)
- St. Gallen: +30.6% (CHF 327.37 → 427.48)
- Valais: +30.4% (CHF 353.25 → 460.73)
- Schwyz: +30.4% (CHF 321.05 → 418.50)
- Schaffhausen: +30.1% (CHF 361.59 → 470.43)
- Bern: +30.0% (CHF 380.40 → 494.42)
- Lucerne: +29.7% (CHF 325.42 → 422.18)
- Vaud: +29.6% (CHF 419.39 → 543.50)
- Grisons: +29.5% (CHF 321.17 → 415.76)
- Glarus: +29.4% (CHF 329.65 → 426.50)
- Appenzell Inner Rhodes: +29.0% (CHF 263.88 → 340.50)
- Obwalden: +27.3% (CHF 303.67 → 386.70)
- Geneva: +27.1% (CHF 480.33 → 610.60)
- Basel-Stadt: +18.3% (CHF 482.15 → 570.60)
- Zug: +8.9% (CHF 298.46 → 324.90)
Average adult premium by canton (CHF per month)
| Canton | 2010 | 2018 | 2019 | 2026 | 2027 | 2019–2027 |
|---|---|---|---|---|---|---|
| Switzerland | 352.88 | 467.04 | 373.36 | 467.10 | 489.20 | +31.0% |
| Geneva | 435.36 | 583.34 | 480.33 | 586.00 | 610.60 | +27.1% |
| Ticino | 386.84 | 495.50 | 409.64 | 582.61 | 603.66 | +47.4% |
| Basel-Stadt | 452.42 | 591.80 | 482.15 | 545.10 | 570.60 | +18.3% |
| Neuchâtel | 381.86 | 510.67 | 415.20 | 529.00 | 558.80 | +34.6% |
| Jura | 364.76 | 511.59 | 408.67 | 520.40 | 551.00 | +34.8% |
| Basel-Landschaft | 368.78 | 511.78 | 415.10 | 521.65 | 544.66 | +31.2% |
| Vaud | 395.68 | 526.52 | 419.39 | 527.21 | 543.50 | +29.6% |
| Bern | 387.05 | 482.52 | 380.40 | 470.38 | 494.42 | +30.0% |
| Solothurn | 326.36 | 458.43 | 369.29 | 466.70 | 493.50 | +33.6% |
| Zurich | 340.87 | 458.93 | 363.00 | 451.94 | 477.08 | +31.4% |
| Schaffhausen | 333.66 | 447.08 | 361.59 | 443.70 | 470.43 | +30.1% |
| Fribourg | 325.06 | 438.01 | 351.40 | 443.41 | 465.48 | +32.5% |
| Aargau | 326.20 | 430.20 | 343.24 | 439.70 | 464.70 | +35.4% |
| Valais | 299.54 | 417.80 | 353.25 | 438.48 | 460.73 | +30.4% |
| Thurgau | 321.95 | 413.60 | 320.47 | 414.00 | 433.20 | +35.2% |
| St. Gallen | 310.86 | 423.66 | 327.37 | 407.11 | 427.48 | +30.6% |
| Glarus | 296.43 | 405.32 | 329.65 | 417.40 | 426.50 | +29.4% |
| Appenzell Outer Rhodes | 276.80 | 403.18 | 311.32 | 405.50 | 422.30 | +35.6% |
| Lucerne | 309.66 | 413.28 | 325.42 | 403.00 | 422.18 | +29.7% |
| Schwyz | 302.10 | 400.87 | 321.05 | 398.30 | 418.50 | +30.4% |
| Grisons | 298.94 | 392.19 | 321.17 | 400.85 | 415.76 | +29.5% |
| Nidwalden | 255.77 | 367.79 | 292.57 | 376.10 | 397.20 | +35.8% |
| Obwalden | 282.93 | 384.60 | 303.67 | 371.30 | 386.70 | +27.3% |
| Uri | 285.15 | 375.94 | 288.07 | 363.30 | 377.70 | +31.1% |
| Appenzell Inner Rhodes | 257.03 | 354.03 | 263.88 | 322.80 | 340.50 | +29.0% |
| Zug | 291.24 | 384.37 | 298.46 | 311.50 | 324.90 | +8.9% |
Frequently asked questions
How much have health insurance premiums risen since 2019?
The average adult premium in Switzerland rose from CHF 373.36 in 2019 to CHF 489.20 in 2027 (+31.0%), according to the FOPH average premiums.
Why does the line drop in 2019?
In 2019 the FOPH changed how the average premium is calculated: since then all chosen models and deductibles count, before only standard insurance with the CHF 300 deductible. The drop is a method effect, not a premium cut.
Calculate the 2027 premium for your commune →
Health insurer comparison by premium region →
Data as JSON
Canton values: the average premium of each FOPH premium region (priminfo, sheet D_PRIM), weighted by the population of the age group in its communes (sheet C_POP). Switzerland: the same weighting over all regions. Deviation from the FOPH's published averages 2024–2026 below 0.6%.
Source: BAG / FOPH, priminfo.admin.ch (praemienregionen_<year>.xlsx) · SLI-2026-10-03.32
Share this overview
Download imageLink copied
All content is purely informational and constitutes no financial, investment, insurance, pension, tax or legal advice, and no recommendation for decisions. No advisory or client relationship is created. Consult licensed professionals for decisions. Beta: errors are possible and all information is provided without guarantee. Privacy: Google Analytics only with your consent; otherwise only cookieless, aggregated statistics; no advertising, no data sales.